
What is a Tweezer Bottom Candlestick Pattern?
Tweezer bottom pattern are two candlesticks that are found at the support levels that have equal bottoms.the Tweezer Bottom candlestick pattern can be formed by multiple candles of any size. The only crucial, distinguishing feature of this signal is that all of the candles involved must have the same low point.
This candlestick signify that the bulls are about to take control of the market for a limited time. it is a bullish reversal candle stick.
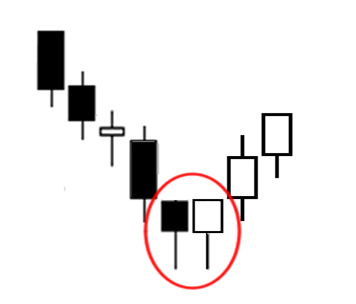
Formation of Tweezer Bottom candlestick
Do you think you've spotted a Tweezer Bottom candlestick pattern? To identify this bullish signal, look for this (very flexible) criteria: First, there must be two or more adjacent candles of either color. Second, a clear downtrend should be present. Third, those candles must reach the same low point.It's generally easy to identify a Tweezer Bottom because the criteria is so simple. Once you have a downtrend, simply look for identical low points. Although we don't recommend that you completely ignore the body color and the shape of the candles, these factors are not critical components of the signal.
Finally, if you notice the opposite of this signal (i.e., an uptrend followed by multiple candles that have the same high point), you have probably spotted a Tweezer Top candlestick pattern, which is a bearish reversal signal.
The widest classification of the tweezer bottom is simply where two adjacent candlesticks touch the same new price low. That is, the lower shadow of the two candlesticks should be near identical.A tweezer-bottom forms as the price reaches a low in a downtrend and stops. To be valid the tweezers need to create a bullish reversal. This typically means that the first candlestick is black and the second white. But this isn’t always the case.
When the shadows reach the same low, the bottom line of the two bars can be different. However in forex chart as with other round-the-clock markets when a white follows a black candlestick they will normally be the same unless the market closes between the open and close.If the second candlestick gaps down or up significantly this wouldn’t be a tweezer but more likely another pattern.The tweezer is seen as a stronger pattern when it reaches a deep penetrating low in the trend. Other factors that enhance the strength are if the white candlestick fully engulfs the black. When this happens the pattern is also a bullish engulfing.
Equally, the reverse of this can also be a strong signal. This is where the first is a long bearish candlestick and the following is smaller, white candlestick. These are known as haramis.
What is The Meaning of the Tweezer bottom?When a trend forms into a tweezer bottom it indicates a possible reversal is building because the market is probably oversold.Breaking down the pattern: The first candlestick in the pattern touches a deep low in price. In the next period the market doesn’t make a significantly lower low but stops; it often then consolidates and rallies.
This is suggesting that buying pressure is returning. The market then closes clearly above the open. This price action produces the neighboring white (bullish) candlestick and the characteristic tweezer bottom (double low) in the chart.Meaning
The depth of this signal's lower shadows signifies an area of support. The bears were not willing to sell below that lowest price, so the bulls returned in great force and pushed the price back up. The fact that two or more candles formed with shadows at this same level confirms the strength of the support and shows that the downtrend will likely pause or reverse into an uptrend.
Like the Tweezer Top, this signal is viewed as a minor, short-term reversal pattern. To better understand its meaning, keep an eye out for these characteristics:
- If this pattern appears at market lows, it is more reliable.
- If the first candle has a large body and the second has a short body, the reversal is more reliable.
- If the Tweezer Bottom is followed by another reversal pattern, such as a bullish Engulfing or Piercing pattern, with identical lows, it is even more reliable.
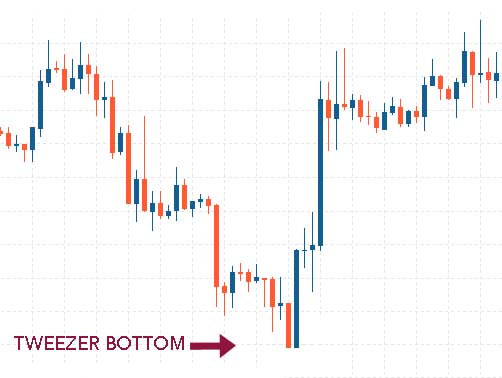
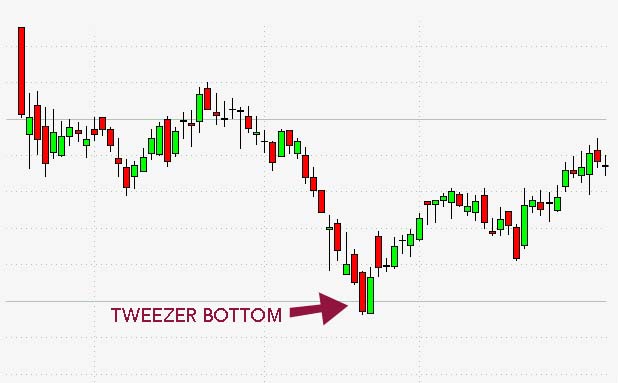
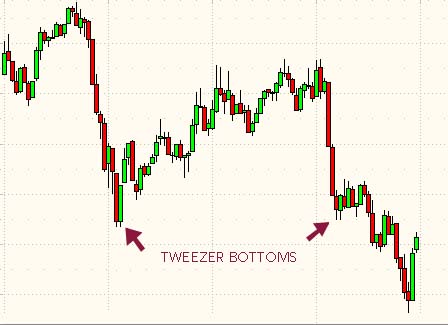
EXAMPLES
As you can see from the trio of examples above, Tweezer Bottom patterns are shapeshifters. Their appearance can drastically change from one chart to the next, so it's important that you thoroughly understand the criteria that defines this signal. To help broaden your idea of what a Tweezer Bottom looks like, and to ensure that you're ready to locate it in the wild, we've selected four examples of this pattern that you can use to test your knowledge.

EXAMPLE 1:
In this first example, a downtrend emerges about two-thirds of the way through the chart. After a few significant downward jumps, a long red candle is followed by a long tan (bullish) candle, forming the Tweezer Bottom. At first, the investors are indecisive; the session closes and opens at nearly the same spot, forming a doji. However, as expected, the price then shoots upward over the course of several sessions. An uptrend has emerged.
EXAMPLE 2:
In our next example, the price progressively dips lower and lower as the chart goes on, steadily forming a downtrend. At the bottom, a red candle is followed by a much longer blue candle. The bullish session opens at the same place the bearish session closed, creating a Tweezer Bottom. Then, two doji appear. This period of indecision might cause you to doubt the Tweezer Bottom, but in fact, the longest candle of the entire chart materializes, solidifying the uptrend.
EXAMPLE 3:
In this example, we ride the rollercoaster a bit before descending to the lowest point on the chart. The low point of the red candle matches the opening of the subsequent green candle, assembling a Tweezer Bottom candlestick pattern. Although the next candle is red, it does gap up. This might cause you to lose your cool, but if you're patient, you'll see an uptrend form. Success!
EXAMPLE 4:
Finally, our last example is twofold. Though it contains two Tweezer Bottoms, they differ in their ability to forecast the future. The first signal forms at the bottom of a downtrend when the bottom wicks of a red candle and a green candle hit the same spot. The price escalates as expected. No surprises here.
When the price finally plummets with a few significant dips, another Tweezer Bottom forms. Upon noticing that the duo's bottom wicks have reached the same spot, you might ready yourself for another uptrend. Unfortunately, the uptrend that occurs is very subtle and brief. Soon, we're plunging downward again. This example demonstrates the importance of confirmation. If you had waited until the day following the Tweezer Bottom to take action, you would see that the subsequent candle does not trade above the two candles in the signal. Best to hold off.
No comments