
How to identify and trade Tweezers Tops (bearish reversal pattern)
The two candlesticks must have either the same high or their real bodies should be at the same high level. The pattern is more reliable when seen in the context of the broader price chart with the pattern appearing at market highs, or near resistance or trend lines.
How to Identify the Tweezer Top Chart
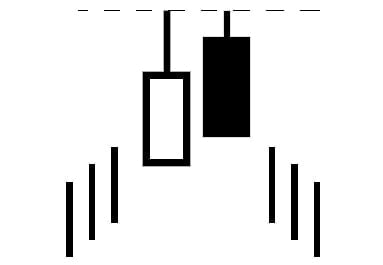
For a chart to satisfy a tweezer top pattern the following must hold.- Two adjacent candlesticks where one or both touch a new recent high
- The first bar is a white and is followed by a black
- The tops of the two bars should be level or nearly level
Because the definition is quite general, the tweezer top pattern comes in a wide variety of forms. To be a valid signal the candlesticks don’t need to be of the same length. Often they won’t be.
The shadow lines which mark highs and lows can also be of different lengths. This leads to different appearances and interpretations.
Formation of Tweezer Top
To identify this bearish candlestick pattern, you'll need to spot the following (very flexible) criteria: First, there must be two or more adjacent candles of either color. Second, a clear uptrend should be present. Third, those candles must reach the same high point.
That's all there is to it! Finding two or more candles side-by-side of either color is a given, of course, but it is the identical high points that allow you to pinpoint the presence of a Tweezer Top candlestick pattern. In a Tweezer Top, the highs are the most important factor. Although you shouldn't completely disregard the body color and the shape of the candles, they aren't critical components.
If you spot the opposite of this pattern (a downtrend followed by multiple candles that reach the same low point), you've found a Tweezer Bottom candlestick pattern, which is a bullish reversal signal. To learn more about that signal, please review our blog post dedicated to Tweezer Bottoms.
The height of the upper shadows signifies an area of resistance. Although the bulls were pushing the price higher, they aren't willing to buy above the highest price. So the bears force their way into the action, returning with great force, and drive the price back down. The identical height of the topmost candles shows the strength of the resistance and indicates that the uptrend will either pause or reverse, forming a downtrend.
This signal is viewed as a minor, short-term reversal pattern. So although the price could delve into a significant downtrend, it probably won't. More likely, it will move downward gradually. To learn more about its meaning, look for the following characteristics:
- If the first candle has a large body and the second has a short body, the reversal is more reliable.
- If the Tweezer Top is followed by another reversal pattern, such as an Engulfing pattern or a Piercing pattern, with identical highs, it is even more reliable.
Examples
Most candlestick patterns have a fairly strict criteria, so their various iterations tend to look somewhat similar. As we mentioned above, Tweezer Top patterns are unique in that they come in a variety of forms, as you can see in the three examples above. To help you catch this pattern in the wild, we've assembled three different examples of it. In each example, we encourage you to try to spot the Tweezer Top on your own (without relying on the arrows, if possible) and then anticipate what will follow. With a little practice, you can add this candlestick pattern to your repertoire.
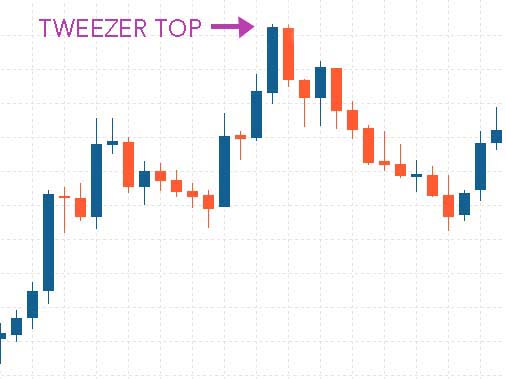
EXAMPLE 1:
In this first example, the bulls succeed in lifting the price despite one minor setback (in the form of a downtrend that mostly moves sideways). The peak of the uptrend conveys a point of resistance; the bulls are not willing to push above that price. At this point, the bears step in and grab the reins. Although the bulls have the strength to push back shortly after, they can't stop the bears from introducing a downtrend. Only at the very end of the chart do the bulls reenter the scene as leaders.
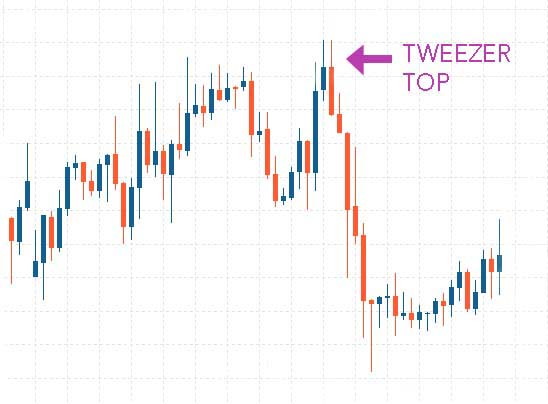
EXAMPLE 2:
This chart conveys a longer session with more jumps and dips. The price hops around during the first half of the chart; though it moves gradually upward, the ascent doesn't go smoothly, and it plunges again at the end. When we finally reach the top of the chart, the bulls strain to move the price higher. As conveyed by the second topmost candle, the price begins at the same place it closed the previous day. The bulls desperately push the price higher at first, but it descends again, forming a red bearish candle. The reversal is stronger than expected, plummeting down like a roller coaster.
No comments