
What are the many forms of Doji Candlesticks and how can I trade them?
.png)
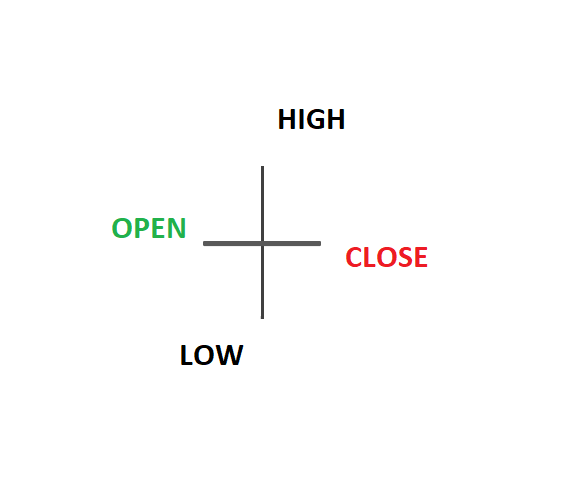
The doji candlestick pattern is a cross, plus, a dash, or a T-like candlestick that appears when a market's opening and closing prices terminate at precisely or nearly the same position during that time period. This candlestick pattern indicates that the bulls (buyers) and bears (sellers) are undecided (sellers)
Traders can use the pattern by itself or in conjunction with other candlestick patterns to identify probable trend reversals.
Types Of DOji
The design is available in several forms, including the common or Standard doji, tombstone doji, dragonfly doji, 4-price doji, and long-legged doji.Common Doji
Long-legged Doji

A trader might interpret the uncertainty and probable change of direction if the Doji indicates the peak of the retracement (which we don't know at the time of its formation). Following that, at the open of the following candle after the Doji, look to short the pair. On the Long-Legged Doji, the stop loss would be put at the top of the upper wick.
Dragonfly Doji

The bottom wick of a Dragonfly Doji is longer, indicating that the open, close, and highest price were all at the same level. Consider it a candlestick in the shape of a 'T.' It might be regarded a positive indication if it occurs near the bottom of a negative swing. When this happens on a support level, it's a big deal. Traders might consider going long on the breakout of the Doji pattern's peak. The Dragonfly Doji can form at the peak of an uptrend or the bottom of a downtrend, indicating the possibility of a direction shift.
Using the Dragonfly Doji in Trend Trading
Looking for Dojis around levels of support or resistance is a common Doji candlestick trading method. The Dragonfly Doji appears near trendline support in the chart below. Although the Doji does not emerge at the peak of the uptrend in this case, traders can still trade based on the information provided by the candlestick.
The Dragonfly Doji indicates that lower prices have been rejected, and the market has since surged upwards, closing near the starting price. The fact that the candle is near trendline support and that prices have previously bounced off this major trendline adds to this probable bullish bias.
Gravestone Doji:
Gravestone doji have the appearance of an inverted letter "T," which is the polar opposite of the Dragonfly doji. When price action begins and ends at the lower end of the trading range, this pattern occurs. Buyers were able to push the price up when the candle opened, but they were unable to maintain the bullish momentum by the close, and the bears pulled the price down to the starting price.
When trading these patterns, it's critical to evaluate the prior trend as well as volume. During the doji session, the most accurate trade signals are formed following a strong preceding trend with greater than average volume. Other types of technical analysis, such as trend line support or resistance levels, can also be used as confirmation.
4 Price Doji:

HOW ARE DOJI CANDLESTICK PATTERNS FORMED?
Within the timeframe of the chart on which the Doji appears, the price of a currency pair opens and closes at almost the same level. Despite the fact that prices may have moved between the open and close of the candle, the fact that the open and close are almost the same price shows that the market has been unable to determine which direction to take the pair (to the upside or the downside).

No comments