
How to use the Hammer candlestick pattern to spot a bullish reversal?
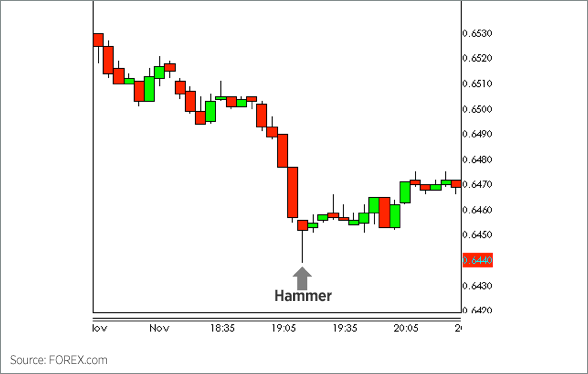
A hammer is a candlestick pattern that appears at the bottom of a downtrend and indicates a positive trend reversal. It features a tiny body with a lengthy lower wick and little to no top wick. If this candle stick is observed in a downtrend, the bottom wick is frequently two or three times the size of the candle body. It's referred to be a market bottom or support. The pattern suggests that the price fell to new lows, but that subsequent purchasing pressure caused the price to close higher, indicating a possible turnaround.
The Hammer's lengthy lower shadow indicates that the market was testing to see where support and demand were placed. Bulls began to drive prices upward, towards the starting price, until the market established a level of support, the day's lows. As a result, the bulls resisted the negative downward movement.
How to Identify the Hammer Pattern?
When the price of an asset trades much lower than the beginning price, it begins to rise and closes around the opening levels. As a result, the bottom shadow of the hammer-shaped candlestick is at least double the size of the true body. As a result, the open, close, and high prices are about equal.When the high and close are almost equal, a hammer pattern is generated. This is a powerful formation, indicating that sellers dominated the market at the start, but purchasers were able to drive the price upward at the conclusion of the term. When the high and open are both at the same level, however, the pattern is less bullish since the bulls were able to neutralize the bears to some extent but were unable to close the prices above the opening level.
Hammers imply possible panic selling by traders in order to construct a bottom during a market drop. This is followed by a price increase, signaling a possible market reversal. All of this happens in a single period of time. The longer shadow implies that the market tried to find demand and support levels. The bulls drove prices higher after reaching the support area.
Advantages
- Reversal signal: The pattern implies that lower prices are being rejected. When detected in a downtrend, it might indicate the end of selling pressure and the start of a sideways or upward trend.
- Exit signal: Traders with an open short position might see the hammer candle as a hint that selling pressure is easing, signaling that it is time to close the trade.
Limitations
- Traders must seek for additional information on the chart that supports the case for a reversal in order to initiate high-probability trades. If the hammer occurs at a large level of support, pivot point, or important Fibonacci level, or if the CCI, RSI, or stachastic indicator provide an overbought signal, this is a sign of confluence.
- No indication of trend: Because the hammer candle does not take the trend into account, it might produce a misleading signal when used alone.
Important facts about hammer candlesticks
- Hammer candlesticks feature a tiny body made up of the open and close, as well as a lengthy wick, indicating a significant intra-day reversal.
- During a downtrend, a hammer candle is the first step toward a reversal indication.
- The close may be somewhat higher or lower than the open.
- If there is no confirmation candle on the hammer candle day, most traders will purchase the next day.
- A hammer indicates that a chart has run out of lower-priced sellers, and buyers have moved in to bid prices back up to the open.
- In compared to the open and closing price ranges, the lower wick is frequently more than double the range.
- The reversal is confirmed if the following candlestick moves higher.
No comments