
what are pin bars Candlestick?
what are pin bars?
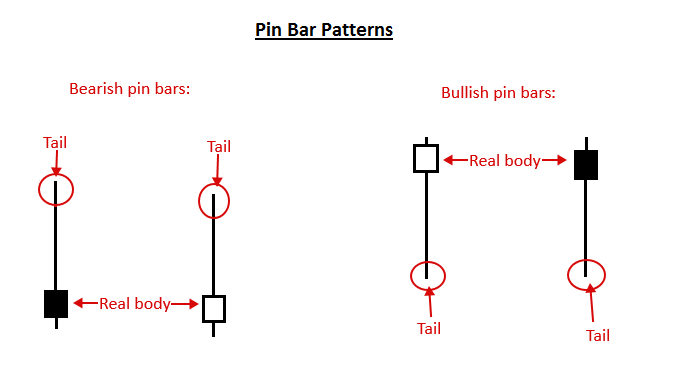
Pin bars, often known as hammers and shooting stars, are a sort of single candlestick design distinguished by its long wick and compact bodies. The pinbar's wicks should typically be longer than the body. The "wick" section of the pin bar and the "body" of the candlestick are basically two segments. We want the body to be tiny in comparison to the wick's size. The pin bars' effectiveness is due in great part to their tiny body and huge wick.
The pin bar characterizes the appearance of the candlestick; it resembles the type of pin seen on noticeboards. Just enough body to keep the pin in place between the thumb and forefinger, and enough spike to keep it stuck in the board. The spike is the tail, and it has a very small nose at times. Pin bars indicate unequivocal rejection, which occurs when buyers outnumber sellers or the other way around for a set period of time.
In an uptrend, you'd anticipate candlesticks to close comfortably higher than they opened, potentially near to or at the high itself - leaving little to no wick to the upside. These candlesticks are said to represent "usually bullish" and imply that the trend will continue.
On the other hand, a candlestick that opens and shoots higher, only to shut back down either below or near to the open – forming the pin bar's characteristic huge wick and small body – might reveal a lot.
For one thing, depending on where the pin bar appears on the chart, it might indicate that price has encountered a huge block of opposing orders. Unlike a more 'rounded' movement using numerous candlesticks, a pin bar will frequently engrave the reversal's foundations into the wick. This is due to the fact that price was able to go in the direction of the trend and then decrease just as much inside the candlestick period. This information can be invaluable at important points (such as horizontal support and resistance levels).
When is a pin bar not a pin bar?
The markets are always shifting direction, and pin bars may develop from time to time, but they usually merely turn out to be a continuation of a trend or a range. How do we recognize these occurrences?
If we glance left after a pin bar develops and completes and observe no previous reversal or congestion at this price level, no special or visible support or resistance to price at this level, then the pin bar may just be a halt in movement before the original direction resumes.
This is why it is important to have confirmation before making a trading choice.
For pin bars to be helpful as a trading signal, they must develop at specified recognized levels, have a specific form and shape, and then price must validate its significance. When the body of a candle is too tiny to be classified as a pin bar, it is more than likely a Doji candle.
Where to Lookout for Pin Bars?
When you return to your markets and charts to look for pin bars, you may note how often you encounter candlesticks that are classified as pin bars — that is, candlesticks with a tiny body and a somewhat longer wick projecting on one side. In this part, we'll look at where to seek for them to get the most bang for your buck.
This implies that a bullish pin bar can have a lower close than the open, but a bullish pin bar with a higher close (and a more openly bullish look) might be deemed a stronger and more visually appealing bullish pin bar. A bearish pin bar will also have a close higher than the open, which is okay but not as desirable as a bearish close.
Refer to the same chart again to see if you can see a bearish pin bar pattern that failed. You may notice that the wick never breached the barrier at the previous swing high, instead forming beneath it.
How to Trade Pin Bars
It also aids in locating pin bars with wicks that protrude away from nearby candlesticks. It may be used as a visual guide to ensure that your pin bars are placed at possible swing moments rather than in sideways market activity or consolidation periods, when their influence may be limited by neighboring support and resistance levels.
Two bullish pin bars can be seen in the chart above. Notice how Pin bar 1 appears to form during a modest downtrend reversal. That is, it took three candlesticks for it to return to the downtrend. As a result, we have a wick that is sufficiently large but does not extend far enough beyond the most recent price movement. It also fails to pierce the swing low to the left a bit further away.
Pin Bar 2 develops at a swing low, and while being smaller than Pin Bar 1, it is still better situated and has a wick that protrudes past the key swing low to the left. In retrospect, the first pin bar failed, but the second one assisted in reversing the negative trend.
When discussing the relevance of former support and resistance zones, as well as swing points, when seeking for greater probability pin bars, it's worth noting that the same important levels, when falling in the pin bar's projected direction yield, can significantly limit the pin bar's efficacy.

Take, for example, the graph above. At a swing high, we see a powerful bearish pin bar. Instead of developing at the crucial resistance level, it forms above it, implying that price may be anticipated to hold as support at the prior barrier – which it does in retrospect.

The market just filled the gap, and price reversed back above the 51.00 round number support and resistance zone in the chart above, which is shown in pale orange.
When looking for pin bars at critical market levels, it's important to anticipate where the price will go if you decide to trade (or otherwise follow) the pin bar as a viable setup. When important levels fall in the way, the odds might be stacked heavily against the direction you would anticipate the price to go in the absence of the pin bar formation.
People trade pin bars in a variety of ways, with different entry and exit techniques, depending on their risk appetite (take profit and stop loss).
Stop-Loss Disclaimer: Placing contingent orders, such as a "stop-loss" or "stop-limit" order, by you, your broker, or your trading adviser may not always restrict your losses to the planned amounts, since market conditions may make such orders difficult to execute.
To obtain a higher price point for the transaction, aggressive futures trading tactics advocate for trading the pin bar at the close and occasionally at a retracement into the pin bar. These methods are based on the assumption that the pin bar and the setup as a whole are powerful enough to predict a swift and persistent move in the direction of the pin bar, as in the case of a huge pin bar projecting into a crucial long-term support and resistance zone.
Taking the trade at the 'break' of the pin bar is a more prudent method. Conservative traders like to set a stop/limit order a few ticks above the bullish pin bar and below the bearish pin bar for this method as a buffer against the possibility that price may never take off in the desired direction.
Consider one of the above-mentioned failed pin bars.
Because the price was allowed to move in the other way past the pin bar's low, we labeled Pin Bar 1 as a failure. It should be noted, however, that it never broke the pin bar's high point. While an aggressive trader would have lost money on this one, a conservative trader would have been safe because a hypothetical stop order a few ticks above the pin bar's high would never have activated.

When it comes to pin bars, traders normally want to stack their stops slightly beyond the wick, so that they may book a loss if the pin bar technically 'fails.' More aggressive traders may position the stop even tighter, possibly just above a round number or a critical market level into which the pin bar's wick protrudes far. Another reason for a tighter stop might be the expectation of a sudden abrupt break of the pin bar due to the setup's strength.

More cautious stop placements may need stops to be placed further away from the pin bar's wick, maybe beyond a round number, or in a more turbulent market where the wick's length may not be adequate to protect against a sudden price movement that is not otherwise hazardous to the setup.
Pin bars are a must-have in every technical trader's arsenal, regardless of whatever method you use to follow and trade them. When it comes to candlestick patterns and their reliability, pin bars are unquestionably the best.
No comments