
What is a bearish engulfing candlestick and how do I trade it?

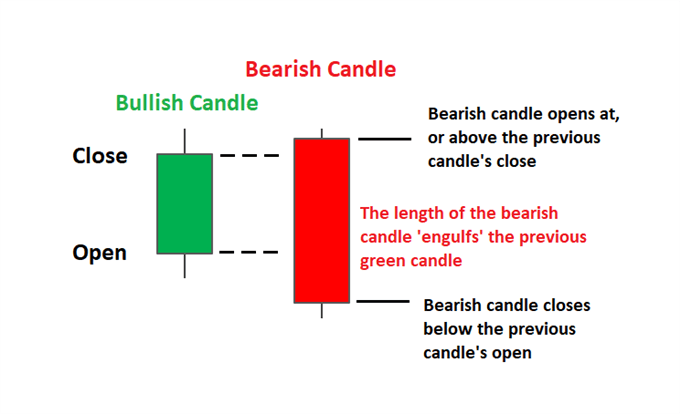
In forex trading, the bearish engulfing candlestick is one of the most prominent and well-known candlestick patterns. It entails a two-candlestick design that occurs at the trend's peak. The candlestick consists of a little bullish candlestick that is entirely covered by the following candlestick, which is a lengthy bearish candlestick, forming a bearish pattern. This pattern indicates that the market has been taken over by the bears.
This forex candlestick pattern will be used by many traders to identify price reversals and continuations in order to support their trading techniques.
- The first candle will depict the end of the established trend strength. It should be noted the size of this primary/bullish candle can vary but it is crucial that the body of this candle gets completely ‘engulfed’ by the candle that follows. Dojis and other small bullish candles provide the strongest signal as they can reflect market indecision in the current trend.
- The second candle in the pattern is the reversal signal. This candle is comprised of a long red candle creating fresh downward price momentum. This bearish candle should open above the close of the previous candle and close well below the low of the previous candle. This strong downward movement reflects sellers overtaking buying strength and often precedes a continued fall in price. The further this secondary/ bearish candle declines, the stronger the signal becomes.
- There is often a lot of confusion on whether the candle should engulf just the real body or the whole candle, including the lower and upper shadows. In my personal experience, as long as the real bodies are engulfed, I would be happy to classify the candle as a bullish engulfing pattern. Of course, candlestick sticklers would object to this but what really matters is how well you hone your skills in trading with a particular candlestick pattern.
HOW TO USE A BEARISH ENGULFING CANDLE TO TRADE
Traders should constantly be on the lookout for trade confirmation, whether it's through indicators, important levels of support and resistance, or any other method that might validate or invalidate a trade. Two techniques to strengthening the negative bias provided by the bearish engulfing pattern are presented below.
Trading the Bearish Engulfing Candle Using Indicators
On the EUR/USD daily chart, the bearish engulfing pattern that appears near the peak of the uptrend is shown in the sample below. While trading against the trend is not recommended, reversals can happen, which is why all traders should be able to recognize when this is likely to happen.
The Euro is gaining and peaking out at the point where the bearish engulfing pattern appears on the chart. With a 'overbought' signal, the Relative Strength Indicator (circled in black) confirms the negative bias.
Traders can enter by waiting for a closing lower than the bearish candle's low or just placing working orders much below the low.
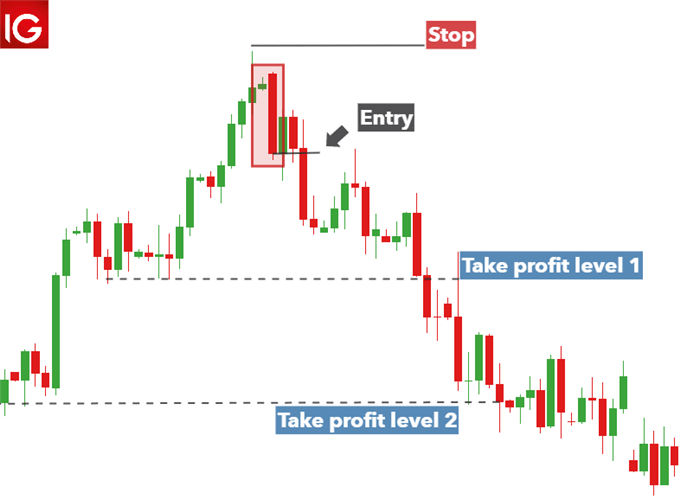 .
.Target/ Take profit: Because bearish engulfing candles might signal the start of a long-term slump, it's a good idea to set an initial take profit level while keeping an eye on future downward movement. Consider utilizing a trailing stop or adjusting your stops accordingly.
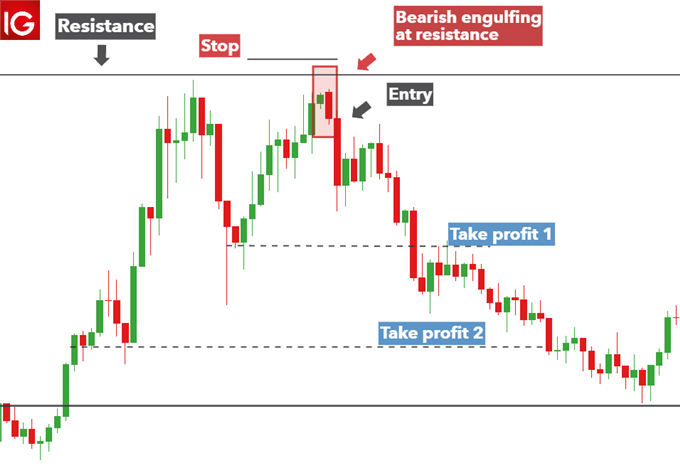
Trading the Bearish Engulfing Candle Using Support & Resistance
On the US Dollar Index, a bearish engulfing candle pattern appears near resistance in the chart below (DXY). The amount of support is significant since it indicates that higher moves have previously been rejected. When the bearish bearing engulfing pattern develops at resistance, it strengthens the bearish bias.
No comments