
How the Bullish Engulfing pattern works
The bullish engulfing candle is one of the forex market’s most clear-cut price action signals. This bullish engulfing pattern is refered to as a chart pattern that forms when a new candlestick opens lower and then closes higher than the entire previous candle. Many traders will use this candlestick pattern to identify price reversals and continuations to support their trading strategies.
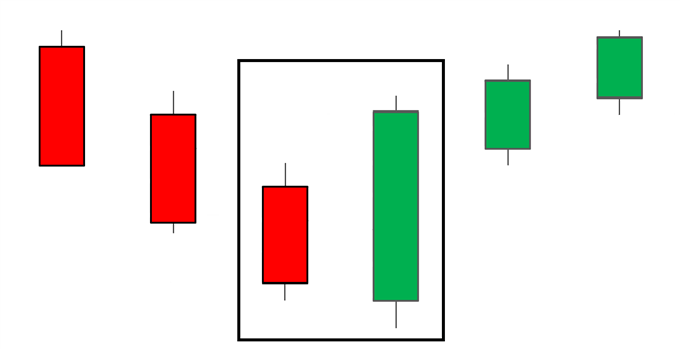
The bullish engulfing pattern often triggers a reversal in trend as more buyers enter the market to drive prices up further. The pattern involves two candles with the second candle completely engulfing the body of the previous red candle. As a bullish reversal pattern, it works best when formed at the bottom of a down trend. According to market professionals, this pattern has been found to accompany a downtrend for an underlying security. This suggests that the end to the underlying asset is close.
The Bullish Engulfing pattern indicates a rise in buying interest which engulfs a range of the prior candlestick low surpassing candlestick highs. As a result, buying action will close at high with little or no upward change.This has been found to move buyers onto the next candle. In case the next candle closes at a high rate than the charting pattern, an uptrend will start to form.
How the Bullish Engulfing pattern works
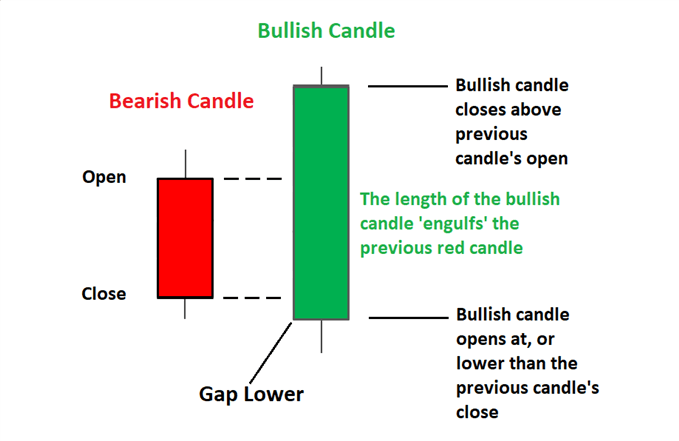
It is a common practice among professional traders to keep an eye on chart patterns. This enables one to identify an uptrend, a downtrend, volume breakouts, momentum and others. In a Bullish Engulfing pattern, you will notice a small red candlestick covered by a larger candlestick.The top of the small red candlestick realbody indicates the opening price while the bottom indicates the closing price of the security. When it comes to the large candlestick, the top part of the realbody (open point) indicates the closing price and the highest price of the day while the bottom part (close point) indicates opening price and lowest price of the day.
Market professionals usually interpret this in the following way – the security opens during the second period lower than the previous close. As a result, investors and traders will start to display a buying interest. If they begin to purchase the security, the price will be pushed higher at the close thus introducing a bullish trend.
How to trade with a Bullish Engulfing Pattern
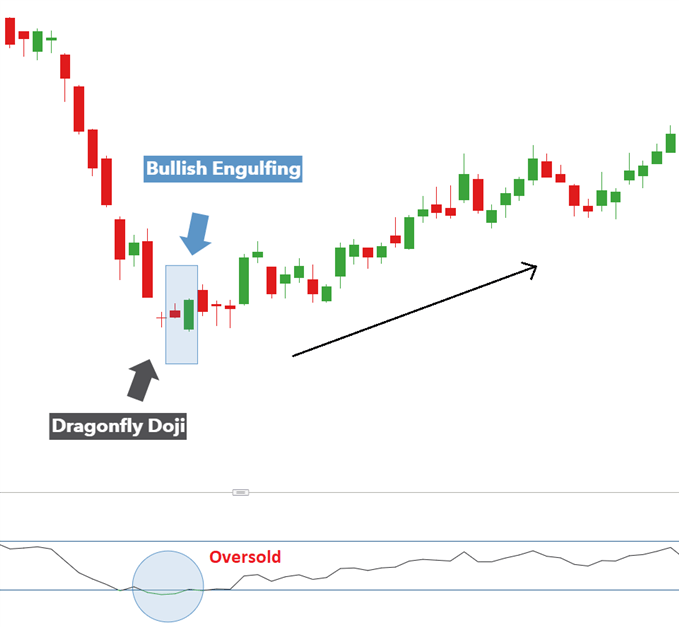
When monitoring a trading chart, you may note a small bearish movement in price. This is followed by a Bullish Engulfing Pattern. What you need to know is that this is where the small red candlestick is overshadowed by the large green candlestick.As a result, the pattern indicates a buying interest. If you were to enter the trade at a buying position especially at the open of the candle, you will end up making a sizeable profit.
By setting a stop loss at the Bullish Engulfing pattern candlestick bottom, the risk for this trade will be two times higher. Trading with this pattern has been found to be effective especially when it follows the sharp decline in price. This is attributed to market forces.
In case of a sharp incline or decline in market prices, investors and traders will lose faith in the market since it’s unable to maintain an incline or decline for a long period.
During trading, amateurs are known to chase price with the hope of profiting from its incline and decline. What you ought to know is that this is a mistake. On the other hand, seasoned traders will enter the trade quickly or take their profits against the volatile price movement.
HOW TO SPOT A BULLISH ENGULFING PATTERN AND WHAT DOES IT MEAN?
Characteristics of a bullish engulfing pattern:- Strong green candle that ‘engulfs’ the prior red candle body (disregard the wicks)
- Occurs at the bottom of a downward trend
- Stronger signals are provided when the red candle is a doji, or when subsequent candles close above the high of the bullish candle.
What does it tell traders?
- Trend reversal to the upside (bullish reversal)
- Selling pressure losing momentum at this key level.
- Advantages of trading with the bullish engulfing candle:
No comments