
How to Recognize a Bearish Harami Candlestick

The bearish harami is a bearish reversal pattern that is thought to indicate the reversal of a trend in the opposite direction. A bearish harami is made up of two candles, the first of which is bullish and is followed by a bearish candle whose body is restricted inside the preceding candle's range. It happens at the peak of an upward trend.
A Bearish Harami is frequently used by technical analysts to start working their way into a short position. Before entering a trade, further confirmation in the form of a bearish chart pattern is sometimes required.
How to Identify a Bearish Harami
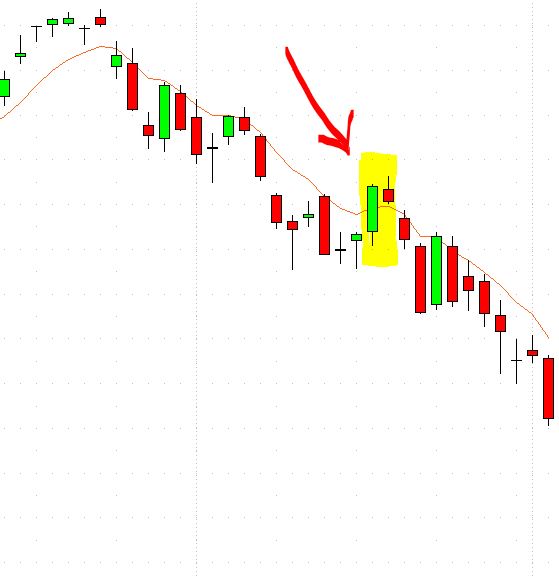
As said, a bearish harami is a trend reversal pattern that occurs at the top of an uptrend.- To identify a bearish harami, here are the things you should look for:
- The first candle is bullish, and part of the advancing market.
- The second candle gaps down. Its whole body is confined within the range of the first candle.
- Ensure that the body of the small red candle measures no more that 25% of the previous bullish candle. Stocks will gap down, showing the red candle mid-way down the previous candle. The gap is likely not found in forex candlesticks as they will mostly open at the same level as the prior candle’s close or very close to it.
- Observe that the entire bearish candle is enclosed within the length of the previous bullish candle’s body.
- Look for confluence with the use of supporting indicators, key levels of resistance or other supporting evidence to support the trade.
What Does a Bearish Harami Signal?
Every candlestick is a reflection of market prices and market mood at the time of movement, just as each candlestick is a representation of market prices. As a result, we can at least try to figure out what's going on in the market.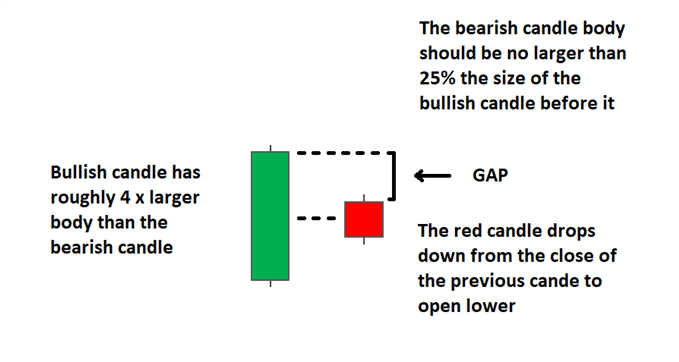
Let's have a look at what a bearish harami has to say about the market!
This interpretation, of course, should not be taken too literally. Knowing exactly what a market has been up to is exceedingly difficult, if not impossible. Regardless, it's an excellent place to begin learning about and evaluating markets.
Market sentiment is bullish when the pattern's initial bullish candle appears. The market is expected to rise, and the market's moves are dictated by purchasing pressure.
While the bullish closing of the candle indicates that the bullish trend will continue, purchasers are getting concerned that the recent price rises will definitely be followed by a trend reversal at some time.
When the following candle opens, sellers begin by pushing the open below the preceding bar's close.
The rest of the trading day is evenly split between buyers and sellers, with neither managing to move the market significantly. The market concludes roughly where it began, with neither buyers nor sellers emerging victorious.
When the market reopens the next day, additional buyers have turned negative after seeing the bearish harami signal. As a result, a negative trend has begun to emerge.

No comments