
What Does a Bullish Harami Look Like?
The bullish harami is one of the most prominent candlestick patterns, and many traders use it to analyze the markets.
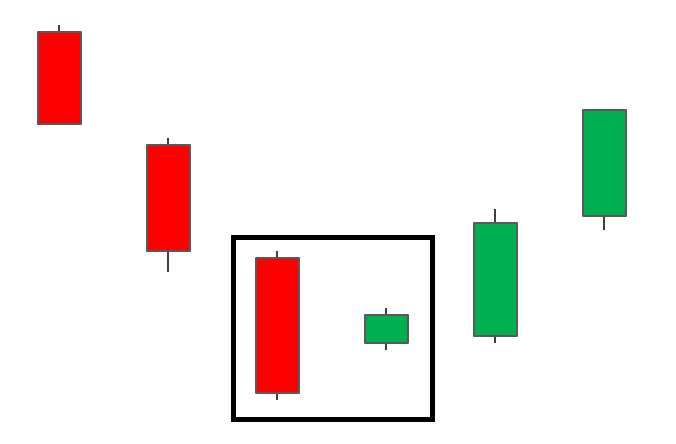
After a downturn, a bullish harami is a two-candle bullish reversal pattern. The initial candle is bearish, followed by a little bullish candle that is contained within the preceding candle's main body. The little bullish candle 'gaps' up to open towards the mid-range of the preceding candle as an indication of changing momentum.
What Are the Signs of a Bullish Harami?
A bullish harami forms after a downtrend, and this is how you identify it:- Spot an existing downtrend
- Look for signals that momentum is slowing/reversing (stochastic oscillators, bullish moving average crossover, or subsequent bullish candle formations).
- Ensure that the body of the small green candle measures no more that 25% of the previous bearish candle. Stocks will gap up, showing the green candle mid-way up the previous candle. Forex charts will mostly show the two candles side by side.
- Observe that the entire bullish candle is enclosed within the length of the previous bearish candle’s body.
- Look for confluence with the use of supporting indicators or key levels of support.
What Does a Bullish Harami Mean?
Every candlestick pattern tells a unique story about the market. Here we wanted to share with you the story of the bullish harami pattern
Remember that it's difficult to determine the specific reasons why a market changes, so don't take these reports too seriously. Nonetheless, they're useful exercises for learning about and investigating marketplaces.
Market participants are largely gloomy since the market is in a decline. The market is dominated by sellers, and purchasers are waiting for a sign that the negative trend is coming to an end.
There is no hint of positive market mood when the first candle of the bullish harami is created. Selling pressure is significant, as it has been in the past, pushing the market farther down.
The market, on the other hand, starts with a positive gap the next day. The bears appear to have given up the advantage overnight, allowing the bulls to reverse the trend.

Throughout the rest of the day, selling pressure seeks to push the market lower, but buyers are always there to keep the market from falling further. The bulls even manage to drive prices higher, but not over the previous bar's open.
This is a big indicator of strength, since it encourages more individuals to place purchase orders, fueling the upcoming rise.
Overall, the bullish harami pattern indicates that bulls were able to not only close the gap to the upside, but also maintain that level for the remainder of the day.
HOW TO TRADE THE BULLISH HARAMI CANDLESTICK PATTERN
Traders can adopt the Bullish Harami using the five-step checklist mentioned earlier in the article. Looking at the below chart on GBP/USD we can observe the following- There is a clear downtrend.
- A Bullish Hammer appears before the Bullish Harami and provides the first clue that the market may be about to reverse.
- The bullish candle is no more than 25% the length of the previous candle.
- The bullish candle opens and closes within the length of the previous candle.
- The RSI provides an indication that the market is oversold. This could mean that downward momentum is bottoming but traders should wait for the RSI to cross back over the 30 line for confirmation.
Stops may be put below the new bottom, and traders can enter at the open of the candle after the Bullish Harami pattern has been completed. Traders might add numerous target levels to ride out a fresh lengthy uptrend because the Bullish Harami occurs at the commencement of a possible uptrend.

Formation of the Bullish Harami Pattern on Stock Charts
Stocks, on the other hand, have set trading hours and are known to gap at the open for a variety of reasons. Some of them might be:
- Company news released after the close of trade
- Country/sector economic data
- Rumoured takeover bids or mergers
- General market sentiment
Ways to Improve the Accuracy of a Bullish Harami
Most traders who employ the bullish harami now add additional criteria and filters to increase the pattern's accuracy. In other words, patterns like the bullish harami should be viewed as little hints as to where the price is heading next, which should be confirmed using other approaches as well.
We wanted to show you a handful of alternative ways we employ to increase the accuracy of different patterns in this portion of the post.
- Using Seasonality
In the markets, there are numerous seasonal affects that go unnoticed. In some markets, for example, one day of the week or one-third of the month may be particularly bullish or bearish.
Now, if you're aware of these characteristics, you may factor them into your analysis. A bullish harami established on a really bullish day, for example, may not be as accurate as one generated on a particularly bearish day. The positive gap and bullish candle might simply be the product of the period's increased strong emotion, and a short retreat rather than a trend reversal.
We employ seasonality extensively in our own trading and have had a lot of success with it!
- Watch Bar Ranges
A pattern created in high volatility situations is sometimes more trustworthy than one generated in low volatility ones. What works best depends on the market and period in which you trade, and you should experiment to determine what works best for you.
Looking at the ranges of the candles is a simple approach to determine the strength of a trend. If the candles leading up to the bearish harami are lengthy and large in comparison to the other bars, the market is powerful and ready to surge higher.
If, on the other hand, the candles leading up to the pattern are little and minor in comparison to other candles, the trend is weak and might quickly break.
Another method of determining the correctness of a bullish harami is to compare the pattern's range to the range of surrounding candles. For example, if the first bearish candle is unusually large and the gap leading to the bullish candle is large, it indicates that the market has experienced what may be the final blowoff before the trend reversal.
- Use Volume
Many times in our own trading tactics, volume has shown to be beneficial. Unlike a price chart, which merely shows how the market moved, a volume chart also reveals the market's confidence. As a result, it may be considered to add a second layer to our trade, assisting us in seeing details that we might otherwise overlook!
The volume of the pattern is usually compared to the volume of the surrounding bars. This gives you an idea of how many market players were involved in the formation of the pattern. In general, the higher the volume of a pattern, the more significant it becomes!
You should now examine the volume of the different candles that make up the bullish harami pattern. If the volume of the bearish candle is very strong, it might imply a final blowoff, as we previously said.
No comments