
Volume Weighted Moving Average as a Trading Indicator
Moving averages exist in a variety of shapes and sizes. The basic moving average, exponential moving average, and VWAP, which is a form of indicator that is better suited for day-trading or intra-day trading, are just a few examples. All of them are based on the same basic premise of smoothing prices by using the average price of recent price movement. However, because of the differences in their formulae and the components that go into them, there will be some differences in how they show on the chart and, ultimately, how effectively they perform for your trade. The Volume Weighted Moving Average, often known as VWMA, is a sort of moving average that differs from the most basic ones and is the subject of this article.
The Volume Weighted Moving Average (VWMA) is a moving average that takes into account both recent close prices and volume. While the computation is different, the application in terms of the trading techniques is very similar. This indicator emphasizes volume by weighing prices depending on the amount of trading activity over a certain time period, with prices with high trading activity receiving more weight than prices with low trading activity.
What Is VWMA?
The volume-weighted moving average, abbreviated VWMA, is quite similar to a standard moving average, as its name indicates. The VWMA, on the other hand, takes volume into account as well, giving close prices that develop under high volume more weight than those that form under low volume.
The volume-weighted MA is based on the idea that price movements that occur in high volume are more meaningful than those that occur in low volume. As a result, adding volume to the equation should result in a more accurate MA-line.
In most circumstances, the WVMA and simple moving average will produce results that are very comparable. This, however, might alter dramatically if the traffic is irregular and some days have large outliers. For example, during periods of extreme volatility, it's usual to see how markets are tossed around and how low and high volume days follow one another. You should anticipate to see the Volume Weighted Moving Average Diverge from the SMA in certain circumstances.
How is VWMA Calculated?
The Volume Weighted Moving Average is quite simple to compute, despite the fact that it has more components than a standard moving average. Rather from just averaging all recent close prices, you multiply the recent close prices by the volume.
So, if you wanted to make a simple moving average of the past two bars, you'd do this:
- Calculate the average volume using every time period in the entire price series being studied (note that this means that the exact value of the moving average will vary depending on which periods you use).
- Average Volume = Average of all Volume for the chart timeframe
- Calculate the volume increment by multiplying the average volume by 0.67.
- Volume Increment = Average Volume x 0.67
- Calculate each period's volume ratio by dividing each period's actual volume by the volume increment.
- Volume Ratio = Divide each bars Volume by the Volume Increment
- Starting at the most recent time period and working backwards, multiply each period's price by the period's volume ratio and cumulatively sum these values until the user-specified number of volume increments is reached. Note that only a fraction of the last period's volume will likely be used.
- Price x Volume Ratio = Multiply each bars Price by its respective Volume Ratio
- Starting with the most recent bar on the chart and working backwards, sum each bars Price x Volume Ratio and each bars Volume Ratio until the summation of the Volume Ratio equals the period selected for the indicator.
- VAMA = Cumulative Sum of Price x Volume Ratio / indicator period.
How to Trade Using VWMA
You're undoubtedly wondering how traders incorporate VWMA into their own trading techniques. Moving averages may be used in a variety of ways, and the implementations of VWAP are not dissimilar to how traders often apply comparable moving averages. Again, the VWMA may be more suited to various markets and periods, as well as specific trading techniques.
You'll need to do some backtesting on past market data to figure out what sorts of strategies and marketplaces work best with the VWAP. That way, you'll have a better idea of what has worked in the past and what is likely to continue to provide earnings in the future.

With this said, we’re going to look closer at three types of strategies that are popular among traders.
- Breakout Trading
- Mean Reversion Trading
- Moving average crossovers
Even if these tactics are well-known and widely used, you should constantly evaluate your strategies against historical data. You can never be certain that a strategy was created for your specific market or period unless you test it yourself.
Let's get this party started!
Breakout Trading(Divergence)
Breakout trading is a strategy for catching significant price moves and expecting them to continue in the direction of the momentum. Breakout traders usually keep an eye on key levels of support or resistance and act on breakouts above or below them. The following are some examples of popular breakthrough levels:
Pivot points with the highest high or lowest low
Moving averages are a type of average that is used to (such as the VWMA)
Many traders prefer to use long-term averages, such as the 200- or 100-period moving averages, when utilizing moving averages. As a result, they seek to initiate long positions when the market rises above the average, and short ones when the market falls below it.
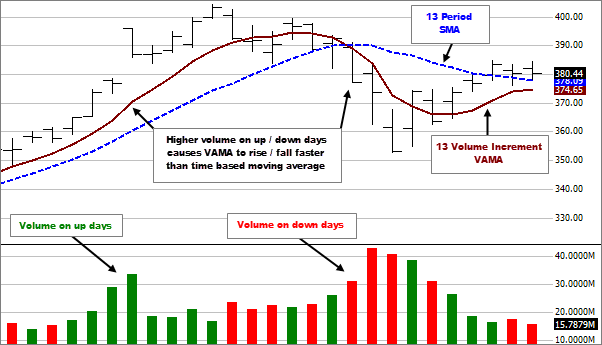
However, because the Volume Weighted MA takes volume into consideration, we may approach breakout trading in a slightly different way with it. When you use a VWMA and a SMA with the same periods, you get two lines that are extremely similar most of the time. The VWMA, on the other hand, will increase or decrease dramatically in relation to the SMA at times.
Using the VWMA's methodology and properties, a quick rise in the indicator line indicates that recent up days have had significantly greater volume than recent down days. As a result, it's possible to claim that the VWMA has strayed from the SMA.
Mean Reversion Trading
Mean reversion is a trading strategy that aims to profit from various markets' mean-reverting characteristics. In simple terms, it indicates that prices tend to overextend themselves both to the upside and to the downside, resulting in a price fluctuation in the other direction as a counter-reaction. As mean reversion traders, we strive to profit from this counter-reaction, or reversion to the mean.

Many swing trading systems, for example, only go long on oversold levels if the market is above its 200-period moving average. To put it another way, it only goes long when the long-term trend supports the expected bullish price swing.
Moving averages are also used to calculate the gap between the close and the MA in mean reversion trading. It's considered that when it hits a specific percentage barrier, the market has been oversold and is about to turn around.
Another typical strategy is to set a profit objective based on a short-term MA, such as 5-10 periods. Most long transactions are placed after the market has fallen, which means the closure will almost certainly be below the short term average.
In general, volume-weighted moving averages may be utilized in mean reversion trading exactly like conventional moving averages. Keep in mind that the results will change somewhat from those obtained by using a simple moving average. This might be beneficial depending on the market!
No comments