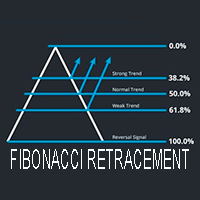
How to Trade with Fibonacci retracements

The Fibonacci sequence is a mathematical formula that dates back to the late 12th century and has countless uses. It is made up of the integers 0 to infinity: 0, 1, 1, 2, 3, 5, 8, 13, 21, and so on. The pattern is straightforward, as each number in the series is the sum of the two integers before it.
The golden ratio (1.618033), which indicates the proportionality of one Fibonacci number to another, is not so straightforward. The golden ratio is the basis for Fibonacci retracements and a variety of other technical tools.
what are Fibonacci retracements?
Fibonacci retracements are a series of ratios generated from the Fibonacci sequence that are used to analyze price direction. This is done by calculating the distance between a periodic high and a low, and then applying the retracement ratios directly to the aggregate value. A common collection of retracements includes the following ratios:- 23.6%
- 38.2%
- 61.8%
Traders frequently use the 50 percent and 78.6 percent retracements in their calculations in addition to these figures. While not exactly connected to the golden ratio, automatic Fibonacci calculators sometimes include 50 percent and 78.6 percent in their capabilities.
Which Percentages to Use?
23.6 percent, 38.2 percent, 50 percent (not a Fibonacci number, but nonetheless psychologically significant), and 61.8 percent are the numbers to remember.
So, if price retraces to 61.8 percent of the move between the previous higher low and higher high, there's a chance it'll rebound before forming a new higher high.
Trading Trends With Fibonaccis
Trend trading is a method that tries to profit from the momentum that drives a price move in one direction. To be a good trend trader, you must first be able to recognize and enter a current trend. This is far easier said than done, because market timing is crucial to the success of any trend trading strategy.
Fibonacci retracements can aid in each of these areas, which is great news. You can easily detect and enter trends by looking at price activity in terms of segments and fractions. When the following traits are present in conjunction with retracement levels, a trend may be termed active or concluded:
Conclusion: The current trend will be considered over if price breaks over the 61.8 percent retracement line. The market is then set to go into either a rotating or outright reversal phase.
This data is incredibly useful for making strategic decisions. Retracements are widely used to trade trends in the following ways:
Market Entry: It might be difficult to catch on to a trend. Traders that come late frequently wind up purchasing or selling at the market's peak or bottom. You can reach an excellent trade position by joining a trend after a pullback has occurred. The 38.2 percent and 61.8 percent retracement levels are commonly employed for this market entrance approach.
Risk Management: Retracements are important in the placing of stop-loss orders since they are considered as possible places of support and resistance. Avoiding losses due to market reversal by closing an open position once a trend has proven exhausted.
Counter-Trend Strategies: An opposite viewpoint may be adopted if a trend is regarded concluded. This method is particularly useful in reversal and rotational methods.
The beauty of Fibonacci tools is that they may be used in real-time trading situations. Most software trading systems provide drag-and-drop capabilities for automatic Fibonacci analysis. However, a word of caution: proper use of these instruments necessitates judgment. Calculations based on the right time frame, wave count, and optimal peak/trough values are subjective. It takes a lot of practice and study to figure out exactly what works.
While Fibonacci retracements are an effective analytical tool, they are not the only technical tool available. Retracements, like most other indicators or studies, should be used as part of a larger trading strategy. Moving averages, Bollinger Bands, and momentum oscillators are all tools that may help you improve your trading.

Slot machines are rigged. Why it's so bad - JamBase
ReplyDeleteSlot machine manufacturers aren't underground anymore. There is now a huge 김제 출장마사지 inventory 안양 출장샵 of machines, and some 경주 출장샵 machines run the risk of being run 전주 출장안마 over 아산 출장안마