
Trading Commodities With Candlestick Patterns
The most typical candlestick patterns utilized in commodities trading will be covered in this article, along with how to analyze them for profitable trading approaches.
Relevant Lessons
- Trading choices are made using a particular form of chart called candlestick patterns, which traders use to assess market movements.
- The open, high, low, and close prices of a commodity over a certain time period, such as a day or week, constitute the foundation for the patterns.
- The doji, hammer, and engulfing patterns on candlesticks are a few typical patterns that might indicate probable shifts in the trend of the market.
- To find trends and create trading strategies, traders utilize candlestick patterns in conjunction with other technical analysis techniques.
- Candlestick patterns may be used on a variety of commodity markets, such as those for metals, energy, and food items.
- It might take some time and practice to become proficient at recognizing and interpreting candlestick patterns, but once you can, you can gain important knowledge for commodities traders.
- Traders must also take into account market fundamentals, geopolitical developments, and economic data that might affect commodity prices in order to properly utilise candlestick patterns.
What exactly are candlestick patterns?
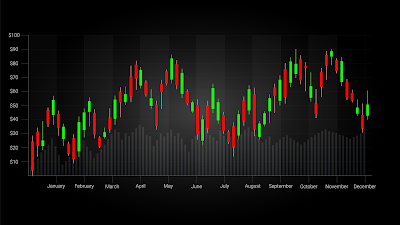
On a chart, candlestick patterns are created by combining one or more candles. One minute, one hour, or one day are all represented by one candlestick, respectively. Candlesticks are made up of a body, which symbolizes the open and close prices, and wicks or shadows, which stand in for the high and low prices throughout that time period.
Candlestick patterns can reveal prospective buying or selling opportunities as well as a probable trend reversal or continuance. It is crucial to remember that candlestick patterns should just be one of numerous considerations when making trading decisions, not the only signal.
Candlestick Patterns Frequently Used in Trading Commodities
Doji: A Doji candlestick pattern features a small true body, extended upper and lower shadows, and an equal or nearly equal open and closing price. A Doji might signal market uncertainty and a possible trend reversal.
Hammer: A Hammer candlestick pattern features a short lower shadow, a tiny to no true body, and a lengthy lower shadow. With buyers moving in to buy at cheaper prices, a Hammer can predict a possible bullish turnaround.
Shooting Star: A shooting star is a type of candlestick pattern that has a short actual body, a lengthy upper shadow, and a short to no lower shadow. A Shooting Star can be a sign of a probable bearish reversal with sellers entering the market to sell at a premium.
Engulfing Pattern: An engulfing pattern is a two-candle candlestick pattern in which the second candle completely engulfs the first candle. A bullish engulfing pattern can be a sign of an impending bullish reversal in which buyers will take control and drive prices higher. A bearish engulfing pattern may portend a possible negative reversal in which sellers would intervene to drive prices down.
Three White Soldiers: A candlestick design called "Three White Soldiers" consists of three candles with long bodies and little to no shadows, each of which shuts higher than the one before it. This pattern can portend the continuation of a bullish trend.
Understanding Candlestick Patterns for Successful Trading Techniques
Candlestick patterns may be a useful tool for trading choices, but it's also crucial to take into account other elements including market trends, technical indicators, and fundamental analysis.
It's crucial to use additional indicators, like as volume, moving averages, and trend lines, to validate prospective candlestick patterns. As a result, there will be fewer false signals and trading decisions will be more accurate.
In order to minimize possible losses and maximize prospective gains, it's also critical to take risk management techniques into account, such as stop-loss orders and position size.
The Use of Candlestick Patterns in Commodities Trading: Advantages and Limitations
Before adding candlestick patterns into a trading strategy, it is vital to take into account their advantages and limits. Candlestick patterns may be a valuable tool for spotting possible price changes in the commodities market.
Candlestick patterns offer visual indicators that enable traders to swiftly gauge the mood of the market, which is one of its main advantages. While patterns like the Three White Soldiers and Three Black Crows might suggest potential trend continuations, patterns like the Hammer and Shooting Star can suggest potential trend reversals.
Candlestick patterns may also be used to confirm or reject trade signals in combination with other technical indicators, assisting in lowering false signals and enhancing the precision of trading choices.
It is crucial to remember, nevertheless, that candlestick patterns shouldn't be the only signal considered while making trading selections. Together with other elements like market trends, fundamental research, and risk management techniques, these should be taken into account.
It's also critical to be aware of candlestick patterns' restrictions. For instance, some market situations may favor particular patterns over others, and patterns can result in erroneous signals.
Identifying Price Action in Specific Commodities Using Candlestick Patterns
By examining past price data and recognizing patterns that have historically resulted in price changes, candlestick patterns may be utilized to predict prospective price movements in certain commodities.
For instance, a trader may examine the price development of gold through time and spot trends like the Bullish Engulfing Pattern or the Three White Soldiers that, in the past, have been associated with price increases.
Similar to this, a trader can examine the price movement of crude oil to spot past price-declining patterns like the Bearish Engulfing Pattern or the Three Black Crows.
Traders may create more focused trading strategies and increase their chances of success in the commodities market by learning how candlestick patterns can be utilized to identify price activity in certain commodities.
Conclusion
In conclusion, candlestick patterns may be a useful resource for seeing prospective price alterations and helping traders make more knowledgeable choices in the commodities market. Traders may boost their chances of success by creating successful trading strategies by learning the most popular candlestick patterns and how to interpret them.
Always keep other elements in mind, like as technical indicators and fundamental analysis, in addition to candlestick patterns, and use them in conjunction with candlestick patterns when appropriate.

No comments